Recall that a Z score for an observation of some variable X is computed as
$$ Z_i = \frac{X_i - \mu}{\sigma} $$
where
xi is the ith observed value of X
μ is the population mean of X
σ is the population standard deviation of X
Zi is the computed z-score corresponding to xi.
Stated another way, a Z score is simply an observation that has been centered about its mean and scaled to its standard deviation. The end result is a standardized version of the variable, whose units are now in terms of "standard deviation units". (A Z score of 1 means that it is one standard deviation above the mean; a Z score of -1 means that it is one standard deviation below the mean.)
In SPSS, you can compute standardized scores for numeric variables automatically using the Descriptives procedure. One important distinction is that the standardized values of the "raw" scores will be centered about their sample means and scaled (divided by) their sample standard deviations; that is:
$$ z = \frac{x - \bar{x}}{s} $$
Running the Procedure
Using the Descriptives Dialog Window
- Click Analyze > Descriptive Statistics > Descriptives.
- Add the variables English, Reading, Math, and Writing to the Variables box.
- Check the box Save standardized values as variables.
- Click OK when finished.
Using Syntax
DESCRIPTIVES VARIABLES=English Reading Math Writing
  /SAVE
  /STATISTICS=MEAN STDDEV MIN MAX.
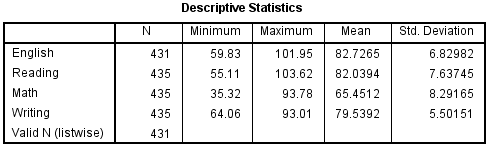
Output
If the computation is successful, then the syntax will be printed in the Output window, and new variables called ZEnglish, ZReading, ZMath, and ZWriting will be added to the Data View.
If you want to compute Z scores for a variable using a known population mean and population standard deviation, use the Compute Variables procedure instead, and enter the Z score formula using the desired population mean and standard deviation values in the expression.