Skip to Main Content

SAS Tutorials: Frequency Tables using PROC FREQ

In SAS, the FREQ procedure can be used to analyze and summarize one or more categorical variables. In this tutorial, we focus on creating simple univariate frequency tables using PROC FREQ.

Introduction

Categorical variables can be summarized using a frequency table, which shows the number and percentage of cases observed for each category of a variable. In this tutorial, we will show how to use the SAS procedure PROC FREQ to create frequency tables that summarize individual categorical variables.

The FREQ Procedure

The FREQ procedure prints all values of a given categorical variable in the Output window, along with the counts and proportions. The FREQ procedure can work with both string (character) or numeric categorical variables.

The basic syntax of the FREQ procedure is: 

PROC FREQ DATA=dataset <options>;
    TABLES variable(s);
RUN;

* Alternately, if you will be using any of the analysis options produced by the TABLES statement:;
PROC FREQ DATA=dataset <options>;
    TABLES variable(s) / <options>;
RUN;

In the first line, PROC FREQ tells SAS to execute the FREQ procedure on the dataset given in the DATA= argument. If desired, additional options you can include on this line are:

  • NLEVELS
    Adds a table to the output summarizing the number of levels (categories) for each variable named in the TABLES statement.

  • ORDER=data
    Sorts the rows of the frequency table in the same order as they appear in the dataset.
  • ORDER=freq
    Sorts the rows of the frequency table from most frequent to least frequent.

On the next line, the TABLES statement is where you put the names of the variables you want to produce a frequency table for. (Note that SAS will recognize both TABLE and TABLES.) You can list as many variables as you want, with each variable separated by a space. If the TABLES statement is not included, then SAS will generate a table for every variable in the dataset. This is all that is required to produce basic frequency tables, but there are many useful analysis enhancements that can be added on this line after a slash (/) character:

  • PLOTS=FREQPLOT
    Adds barplots to the output for each variable.
  • BINOMIAL
    Adds a binomial confidence interval and binomial test of proportions.
  • MISSING
    Include missing values as a row in the frequency frequency tables. The missing category will be treated as if it were an observed category, so those cases will be included in the computation of the percents, cumulative frequencies, and cumulative proportions.
  • MISSPRINT
    Include missing values as a row in the frequency tables, but do not count those cases towards computing the percentages, cumulative frequencies, or cumulative proportions.

Sometimes, your dataset may contain a “count” variable. In this case, the WEIGHT statement specifies which variable acts as the frequency variable. This statement would be given after the TABLES statement.

Example 1: Basic Frequency Table with PROC FREQ

Recall that in our sample dataset, the variable State is a nominal categorical variable (representing whether the student is an in-state or out-of-state student), while variable Rank is an ordinal categorical variable (representing the student's class rank).

  • A nominal categorical variable's categories do not have any intrinsic order.
  • An ordinal categorical variable's categories can be ordered in a meaningful way.

Recall also that State is a string variable, and Rank is a numeric variable. This simply means that the observations for Rank were recorded as numbers (with value labels applied later), while the observations for State were recorded as characters (strings). This example will show that PROC FREQ works for both types of variables.

Problem Statement

Create frequency tables for the variables State and Rank.

Syntax

PROC FREQ DATA=sample;
    TABLE State Rank;
RUN;

Output


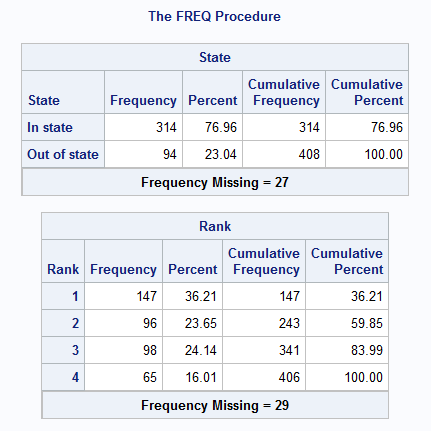
PROC FREQ creates one frequency table per variable. Each frequency table contains four columns of summary measures:

  • The Frequency column indicates how many observations fell into the given category.
  • The Percent column indicates the percentage of observations in that category out of all nonmissing observations.
  • The Cumulative Frequency column is the number of observations in the sample that have been accounted for up to and including the current row. It can be computed by adding all of the numbers in the Frequency column above and including the current row.
  • The Cumulative Percent column is the proportion of the sample that has been accounted for up to and including that row. It can be computed by adding all of the numbers in the Percent column up to the current row.

If there are cases with missing values for the variable, the number of missing values are given below the table.

If you do not specify an ORDER option in the PROC FREQ statement, the frequency table will be sorted by the values of the categories. This means that, for string variables, the categories will be ordered alphabetically, while numeric variables, the categories will be ordered from smallest to largest number code.


Problem Statement

Suppose we want to create frequency tables, but we'd also like to know the number of distinct categories for each variable. (This can be useful if you have a variable with many categories, where the number of rows in the frequency table can't easily be determined by a quick scan.)

To do this, we add the NLEVELS option to the PROC FREQ statement.

Syntax

PROC FREQ DATA=sample NLEVELS;
    TABLE State Rank;
RUN;

Output

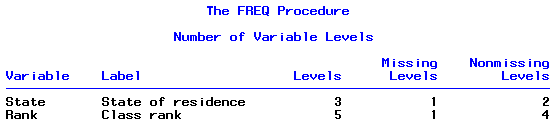
Adding the NLEVELS option to our syntax will add one new table to the output, right at the beginning:

The new table shows how many "nonmissing levels" (i.e., observed categories) and how many "missing levels" (i.e., how many special missing value codes were present in the data). For variable State, there are two nonmissing levels; for variable Rank, there are four nonmissing levels. These are easily confirmed by scanning the rows of the corresponding frequency tables.

Example 2: Descending Order by Counts

Problem Statement

SAS normally orders the rows of the frequency table based on the order of the category values. In some cases, we may wish to sort the rows of the frequency table based on descending counts. This makes it much easier to determine which categor(ies) were the most frequently occurring.

Syntax

PROC FREQ DATA=sample ORDER=freq;
    TABLE State Rank;
RUN;

The ORDER=freq option in the first line of the syntax tells SAS to order the values in the table in descending order.

Output

Discussion

With the rows of the frequency tables ordered by relative frequency, it's much easier to tell which categories are the most common. For variable State, there are many more in-state students than out-of-state students. For variable Rank, the most common group is Freshmen (category 1), followed by Juniors (category 3).

When including a frequency table in a write-up or report, it's usually preferable to order tables for nominal categorical variables by frequency. However, for ordinal categorical variables, it usually makes more sense to order the table with respect to the level of the categories.

Example 3: Including Missing Values as a Category

Problem Statement

Notice that in the previous tables, the counts are based only on the number of nonmissing observations. The number of missing values is printed below the table, but the number in the last row of the "cumulative frequency" column is the total number of nonmissing values for the variable. A consequence of this is that the proportions in the table represent the proportion of of nonmissing cases. What if we instead want the proportions to be based on the total number of cases (i.e. number of nonmissing values + number of missing values)?

To do this, we can add the MISSING option to the TABLE statement:

Syntax

PROC FREQ DATA=sample;
    TABLE State Rank / MISSING;
RUN;

The MISSING option appearing after the slash (/) in the TABLE statement tells SAS to include the missing values as a row in the table.

Output

Discussion

After adding the MISSING option, notice that the first row of the table is now the number of missing values. Since variable State is a string variable, the row has a blank label; and since variable Rank is a numeric variable, the row has a "." label.

If we compare the proportions in this table to the ones in the previous examples, we can see that the proportions have changed. It is also easier to see that approximately 6% of the responses are missing for both State and Rank (before, we only saw the number of missing responses for those variables).

Note: If you specify ORDER=FREQ in the PROC FREQ statement and include the MISSING option in the TABLES statement, the missing values will always appear as the first row of the table, even if they aren't the most frequently occurring category. The ORDER option will affect the ordering of the nonmissing categories that appear after the missing category.